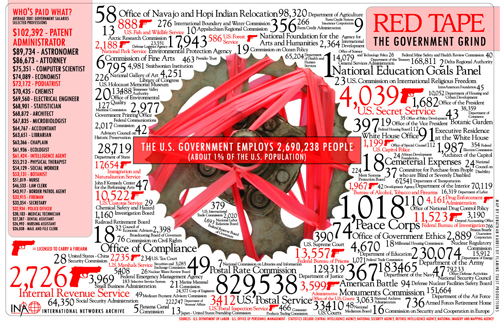
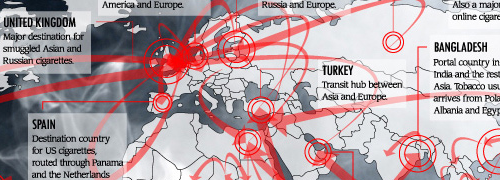
I was hunting for a link I’d omitted from a previous post and came across an old bookmark for these infographics (found originally via Chris Glass). I especially like the red tape one, and the map part of the tobacco one is great.

I was hunting for a link I’d omitted from a previous post and came across an old bookmark for these infographics (found originally via Chris Glass). I especially like the red tape one, and the map part of the tobacco one is great.